Download the study in pdf-file format
I. INTRODUCTION
The Institute of Car Market Research has processed an array of data from the State Customs Service on the import of cars in Ukraine, compared the indicators of the first quarter of 2021 with last year, and identified the main trends.
The study examines the import of new and used passenger vehicles — intended for the carriage of passengers, with a number of seats not exceeding nine (including the driverʼs seat), corresponding to heading 8703 in accordance with the UKT FEA.
The source of statistical information was the web resource of the State Customs Service of Ukraine "Indicators of Foreign Trade of Ukraine".
ІІ. IMPORT DYNAMICS
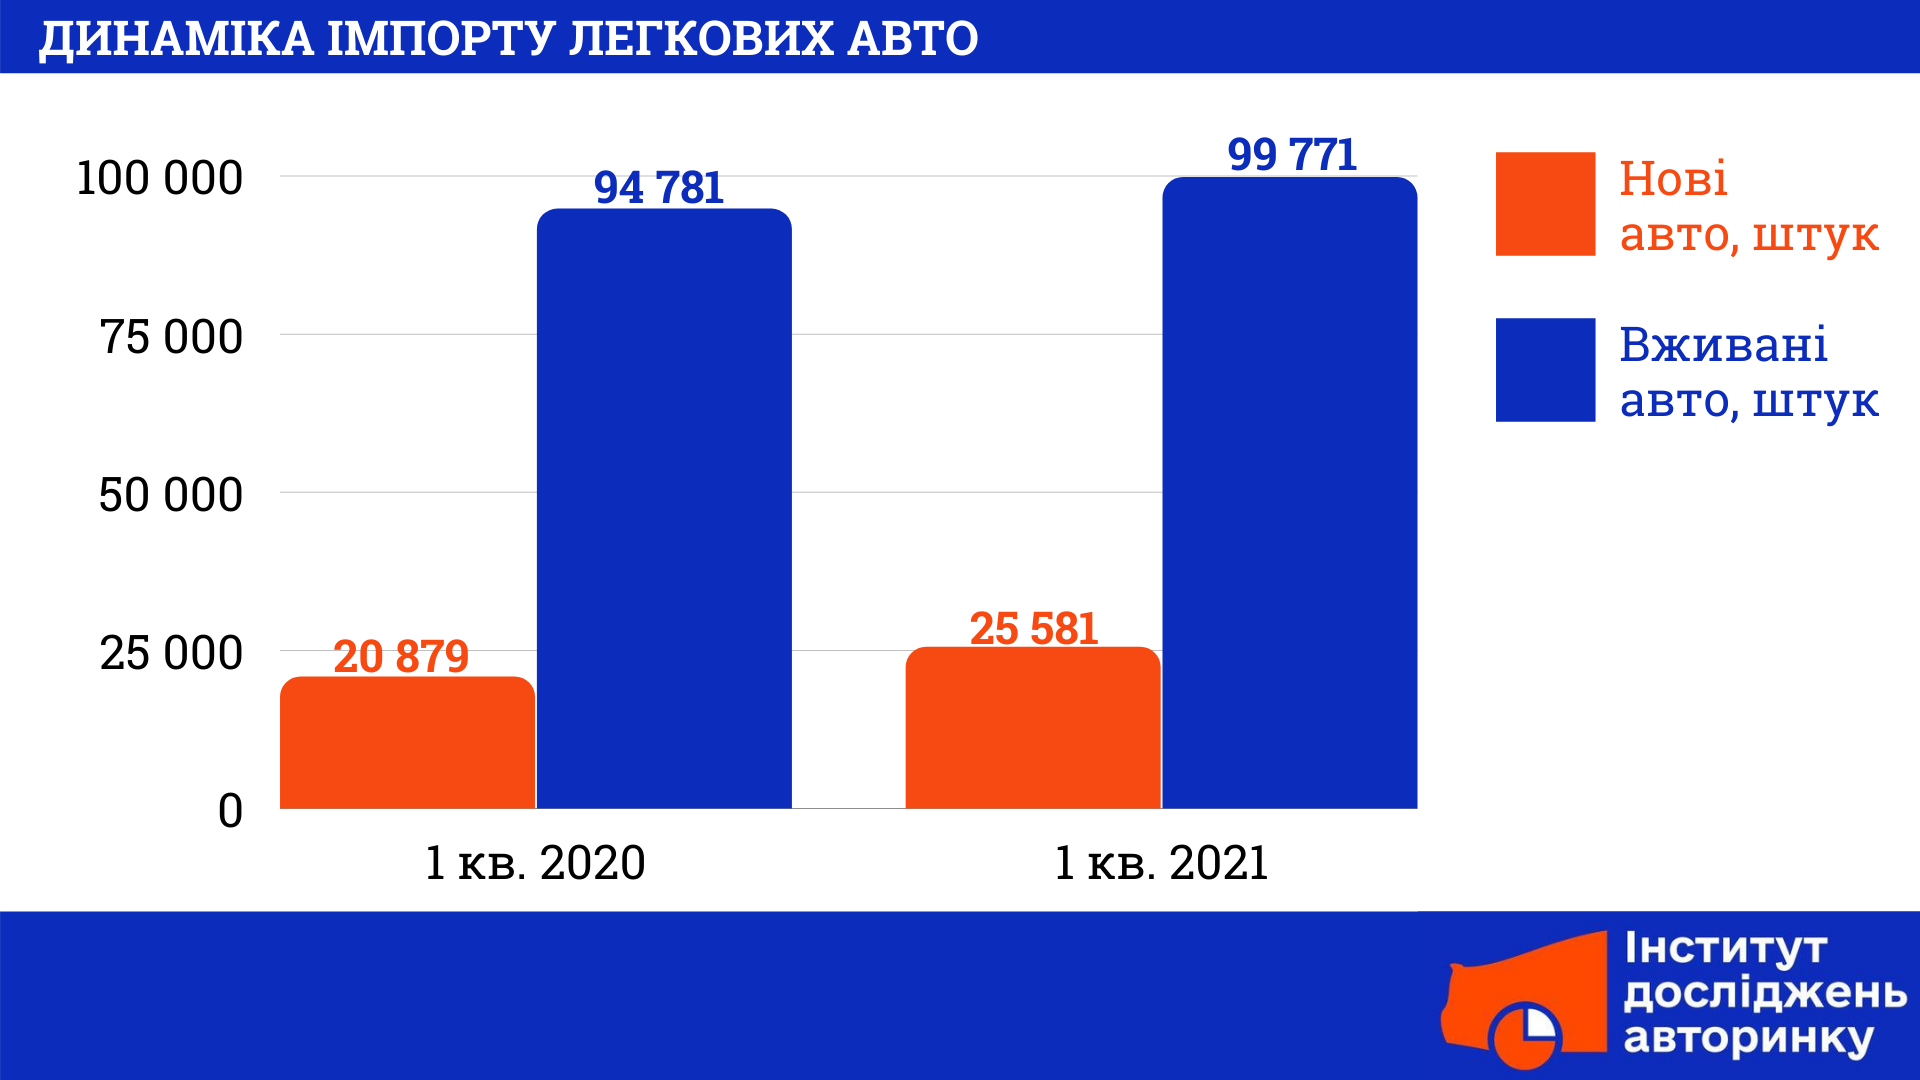
During the 1st quarter of 2021, 125,352 units were imported to Ukraine. passenger cars for the total amount of 920.9 million dollars, which is 8.4% more than in the same period of 2020 in physical terms and 11.9% more in monetary terms. Ukrainians spent in 1 square. 2021 for the purchase of cars from abroad by almost 100 million more than for the same period in 2020. The total value of imported new cars increased by $ 92.3 million, used — by $ 6.1 million.
In particular, the import of new cars in the 1st quarter of 2021 compared to the same period in 2020 increased by 22.5% in physical terms and by 22.9% — in monetary terms, and amounted to 25,581 units. with a total value of 495.6 million dollars. Imports of used cars in the study period increased by 5.3% in physical terms and by 1.5% in monetary terms compared to the corresponding period of 2020 and amounted to 99771 units. with a total value of 425.4 million dollars.
IMPORT DYNAMICS TRENDS
- Despite the quarantine, the total import of cars has increased.
- The vast majority of imports are used cars. Four times less new cars are imported. Imports of used cars are 4 times higher than imports of new ones: almost 99,771 cars out of a total of 125,352 imported cars for 1 sq. Km. 2021.
- The growth of imports of used cars did not lead to a decline in imports of new cars, and vice versa.
III. STRUCTURE OF IMPORTS OF CARS BY ENGINE TYPE
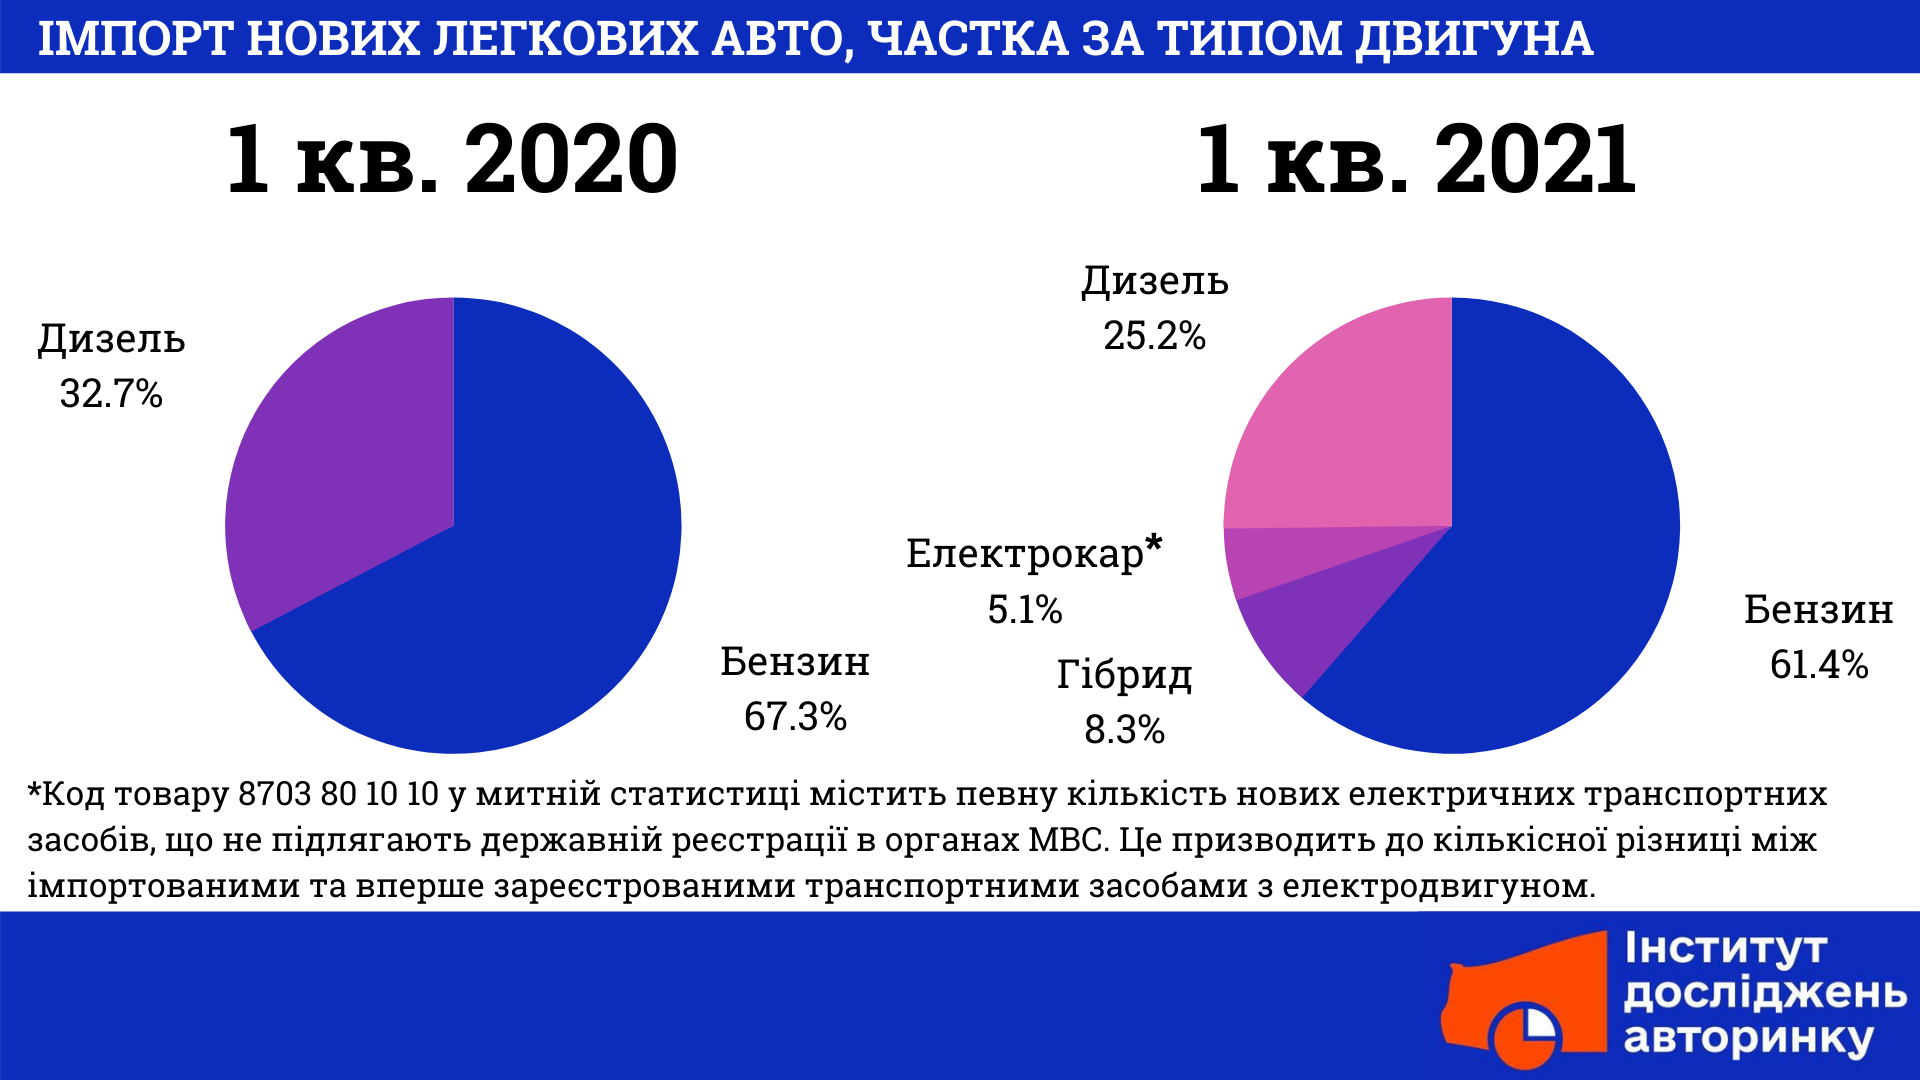
Imports of new cars in the 1st quarter of 2021 consisted of: 15,705 units. (61.4%) — a car with a gasoline engine, 6,448 units. (25.2%) — a car with a diesel engine, 2,122 units. (8.3%) — hybrid cars, 1,306 (5.1%) — electric cars. For comparison, the structure of imports of new cars in the 1st quarter of 2020 was as follows: 14,053 units. — a car with a gasoline engine, 6,826 pcs. — car with a diesel engine.
As for the import of hybrid cars, until July 1, 2020 there was no classification according to UKT FEA, so this type of car was imported according to the items corresponding to the type of internal combustion engine with which they were equipped.
Regarding the import of electric cars, until July 1, 2020 there was no division into new and used according to the classification of UKT FEA. It is also worth noting that the product code 8703 80 10 10 in the customs statistics contains a certain number of new electric vehicles that are not subject to state registration in the Ministry of Internal Affairs. This leads to a quantitative difference between imported and newly registered electric vehicles.
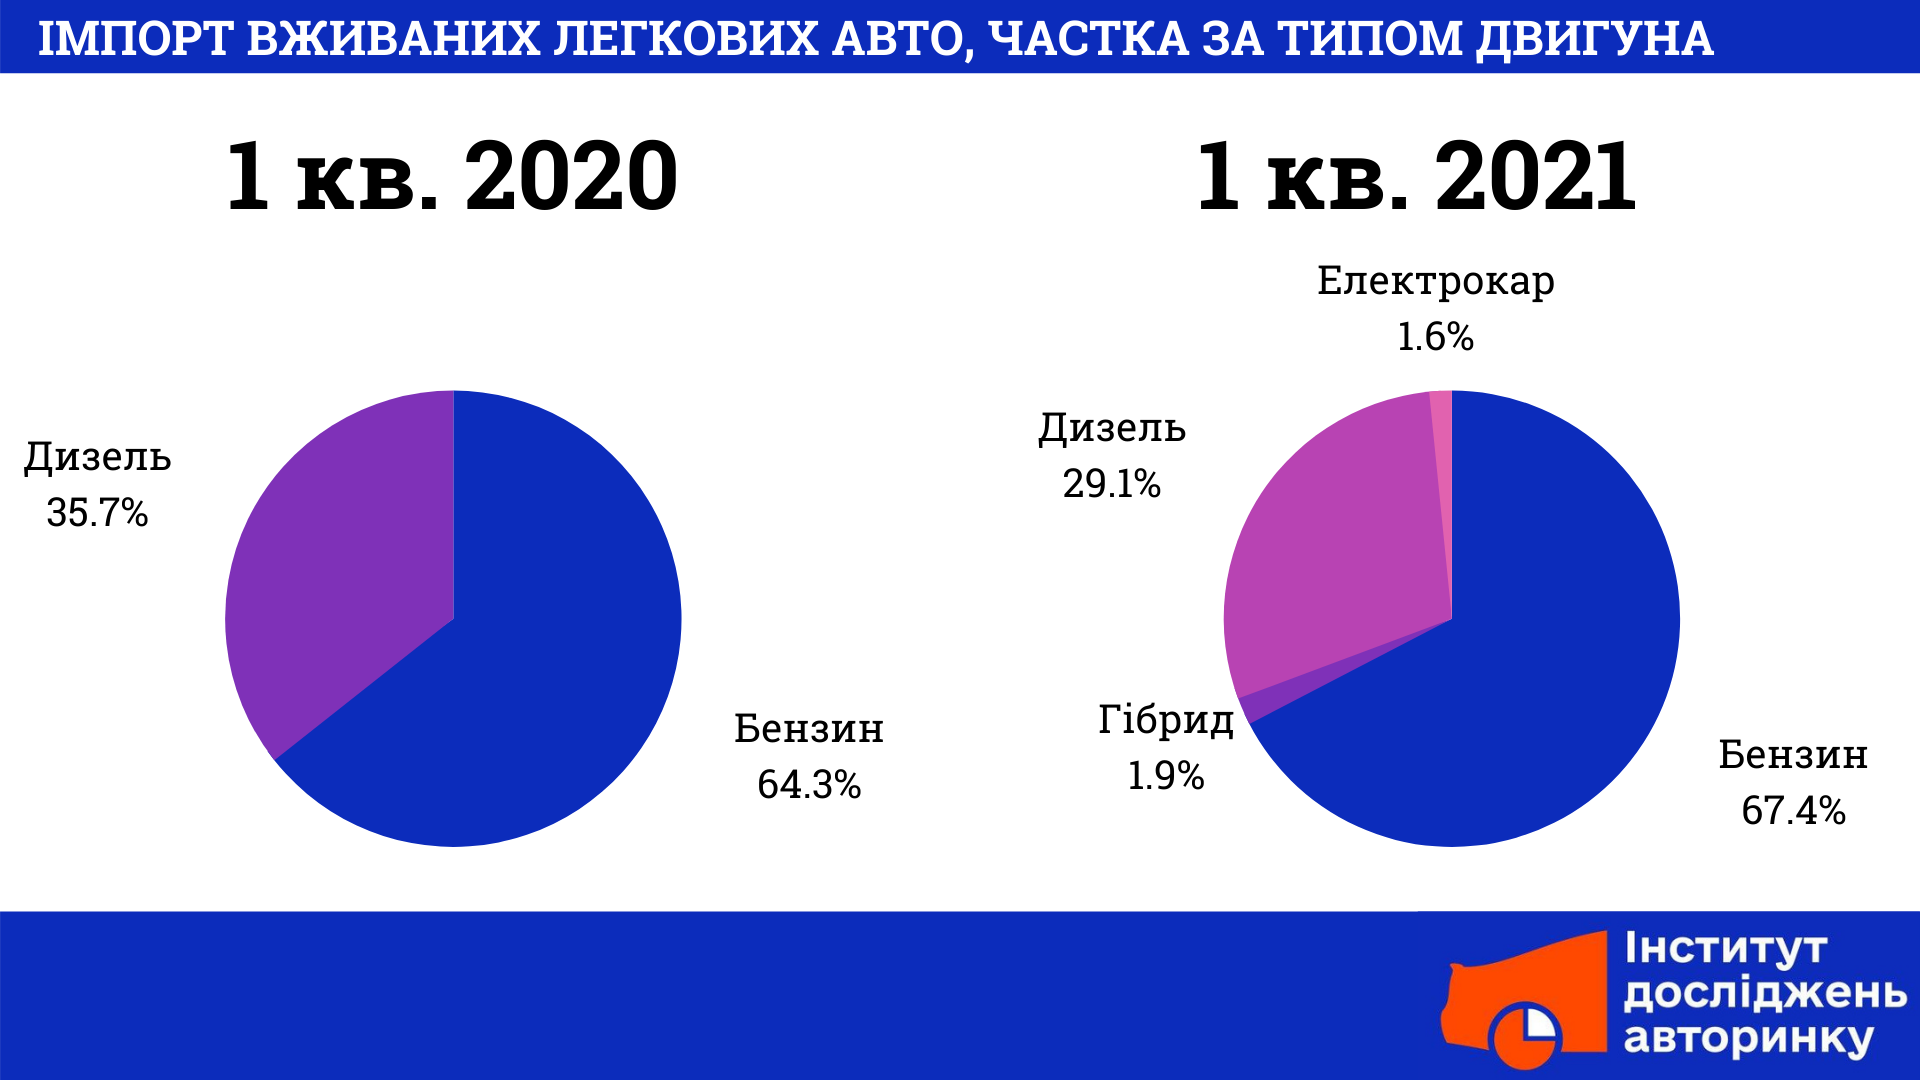
Imports of used cars in the 1st quarter of 2021 consisted of: 67,223 units. (67.4%) — cars with a gasoline engine, 29,027 (29.1%) — cars with a diesel engine, 2,122 units. (1.9%) — hybrid cars, 1,306 (1.6%) — electric cars. For comparison, in the 1st quarter of 2020, 59,211 used cars with a gasoline engine and 32,811 cars with a diesel engine were imported.
TRENDS IN THE STRUCTURE OF IMPORTS BY ENGINE TYPE
- Most new and used cars from abroad are petrol, their share in the 1st quarter of 2021 has increased compared to the same period in 2020. Thus, 1.6 thousand more new cars with a gasoline engine and 8 thousand more used cars were imported to Ukraine.
- Instead, the popularity of used diesel cars has fallen. Within 1 sq. Km. In 2021, the share of diesel cars decreased from 32% to 25% in imports of new cars from abroad, and from 35% to 29% in imports of used ones.
- Hybrid cars and electric cars are a minority, their market share is 3% and 2% respectively.
IV. AVERAGE CUSTOMS VALUE AND TAX LOAD ON CAR
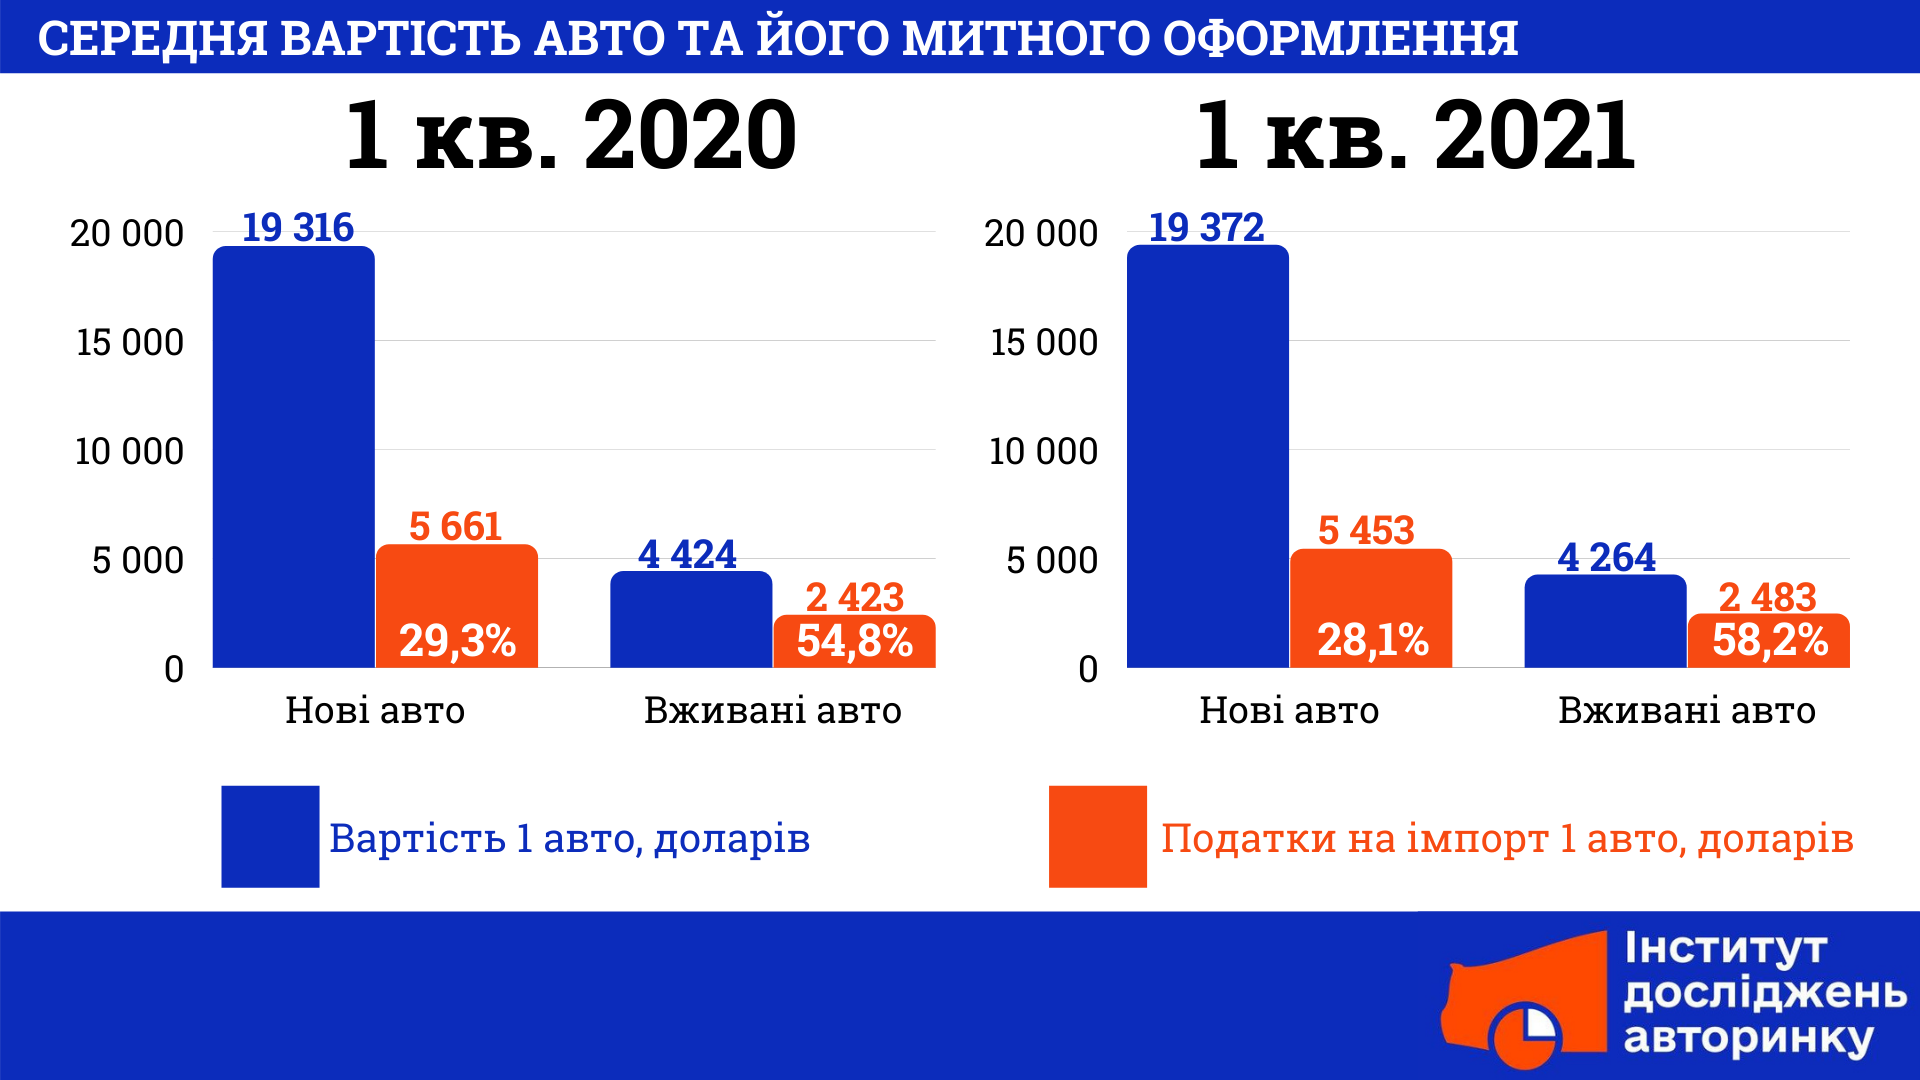
The average customs value of imported new cars in the 1st quarter of 2021 was $ 19,372, while the tax burden on one such car was $ 5,453. (28.1%). Compared to the 1st quarter of 2020, the average customs value for new cars has not changed and increased by only 0.3%, while the average tax burden decreased by 3.7%.
At the same time, the average customs value of imported used cars in the 1st quarter of 2021 was $ 4,264, while the average tax burden on one such car was $ 2,483. (58.2%). Compared to the 1st quarter of 2020, the average customs value of used cars decreased by 3.6%, while the average tax burden increased by 2.4%.
TRENDS IN THE COST OF CUSTOMS CLEARANCE
- Customs clearance of used cars is twice as expensive as customs clearance of new ones. The average cost of customs clearance in 1 sq. Km. In 2021 it amounted to 28% of the cost for new cars and 58% — for used ones.
- The customs value of new cars has hardly changed, and used cars have decreased. Comparing the performance of 1 sq. Km. In 2021, with the same period in 2020, we can conclude that the average customs value of new cars increased slightly, and used — decreased.
TENDENCIES OF TAX PAYMENT DURING CAR IMPORT
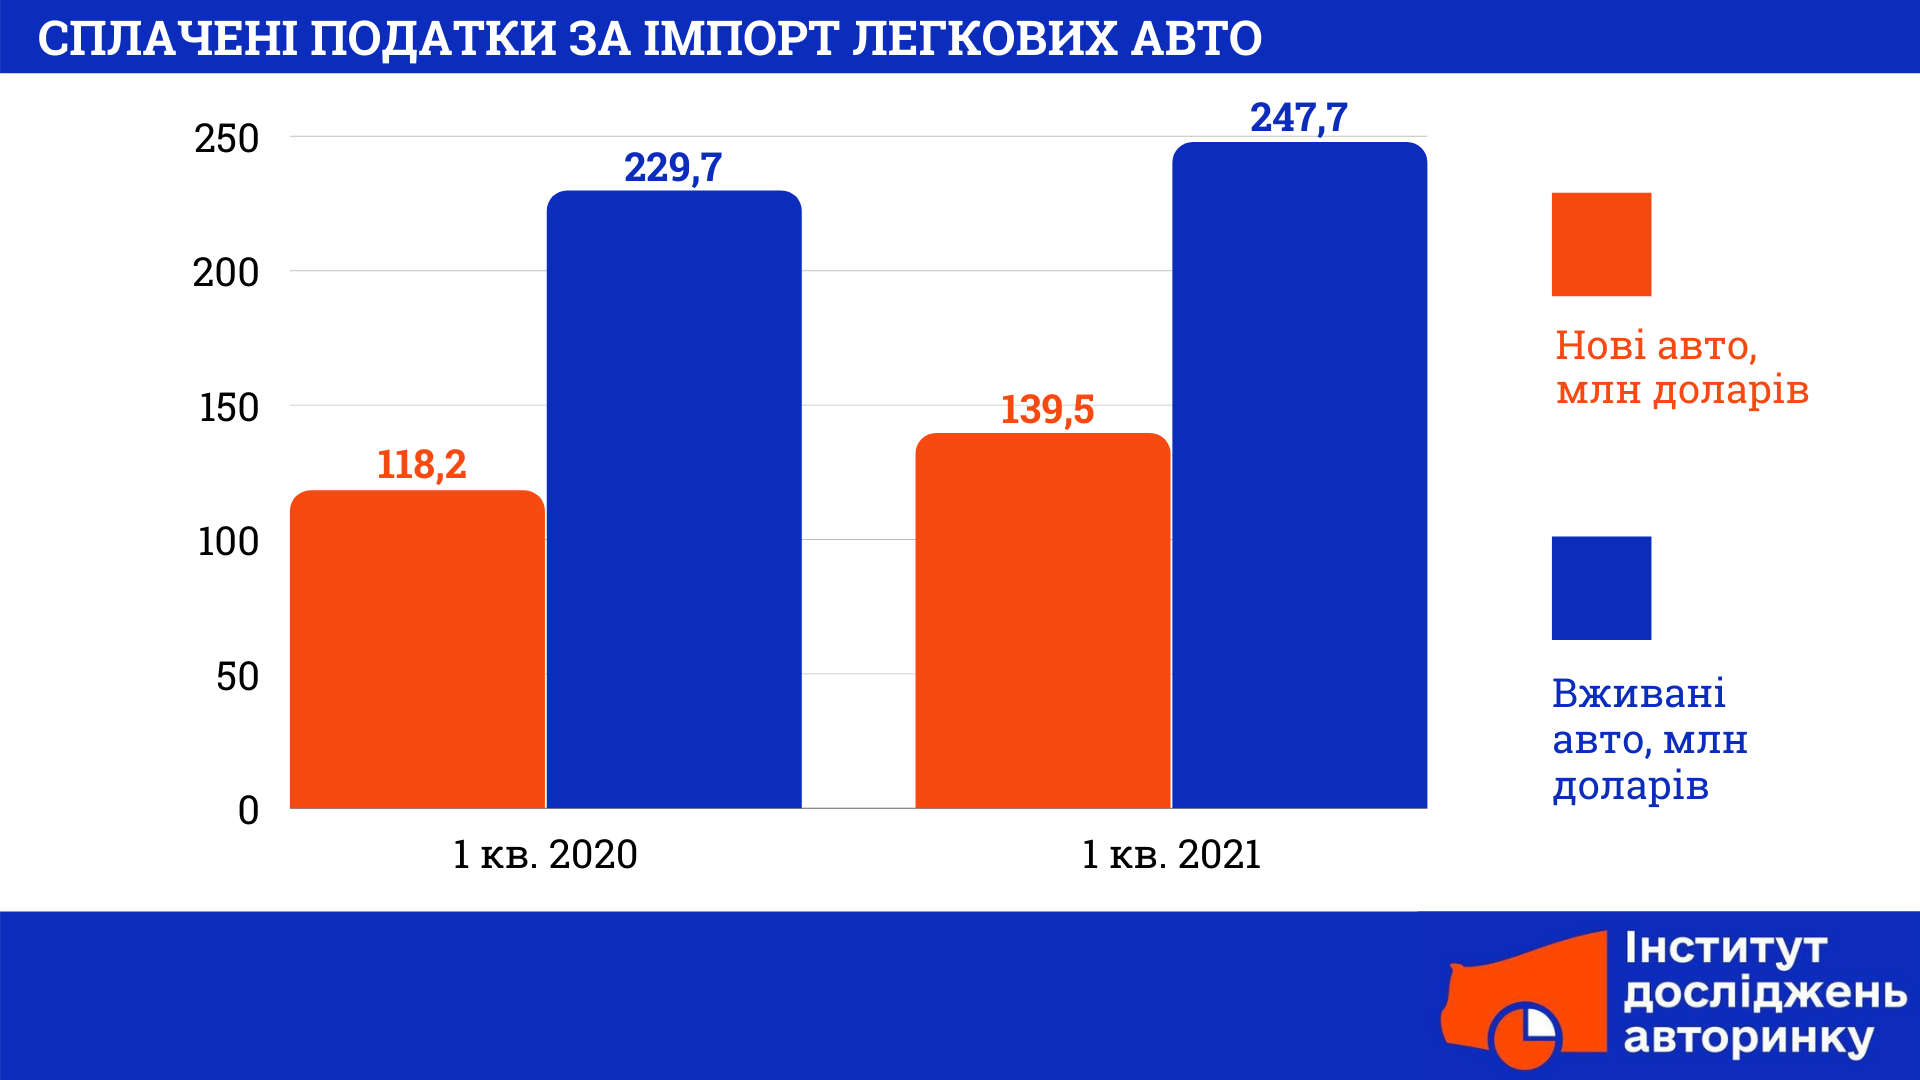
- The budget received more taxes for customs clearance. In 1 sq. In 2021, Ukrainians paid $ 387.2 million in taxes for customs clearance of cars from abroad. This is $ 40 million more than in the same period in 2020.
- Almost twice as many taxes were paid for customs clearance of used cars as for customs clearance of new ones. During the 1st quarter of 2021, Ukrainians paid $ 247 million for customs clearance of used cars and $ 139 million for new ones.
V. STRUCTURE OF IMPORTS OF CARS BY COUNTRY OF ORIGIN
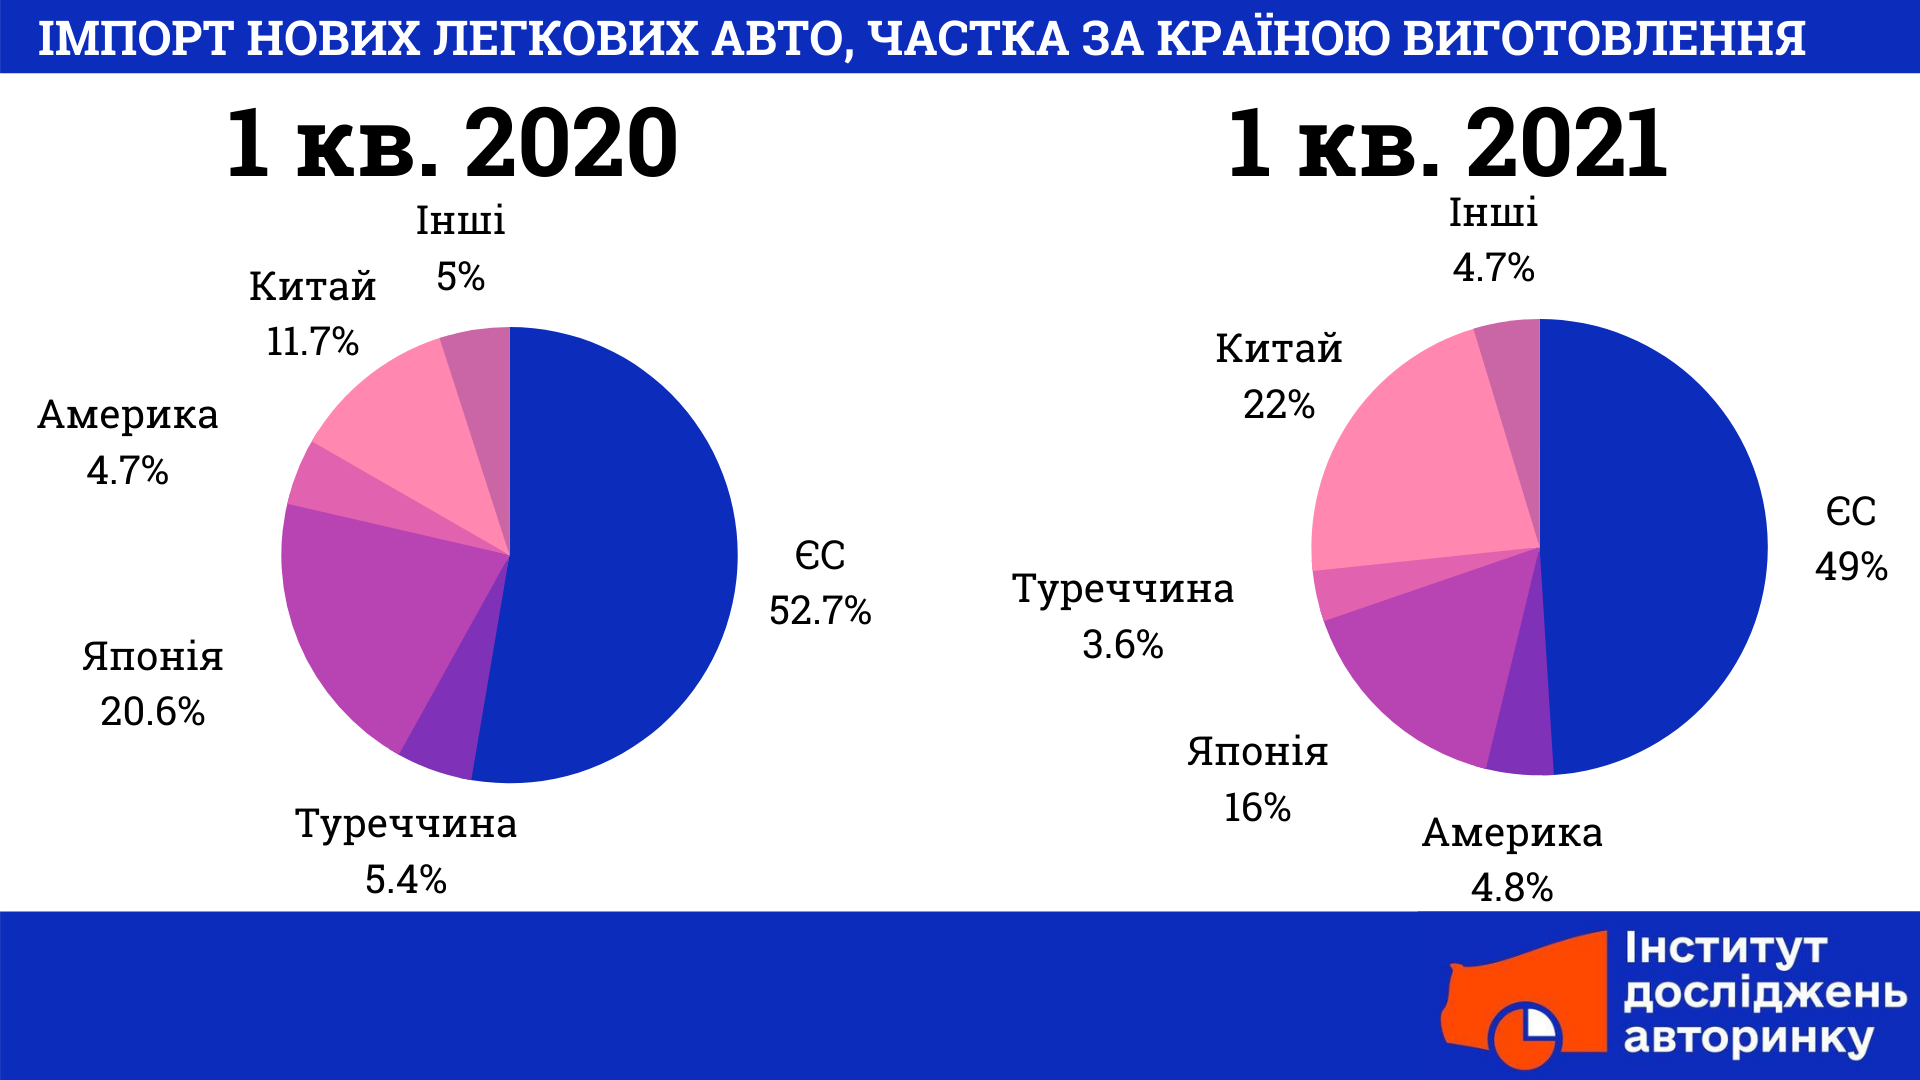
The structure of imports of new cars by country of origin in the 1st quarter of 2021 was as follows: 12,535 cars (49%) for a total of 293.2 million dollars. were manufactured in EU countries; 5,625 (22%) worth $ 16.4 million. — in China; 4082 (16%) in the amount of 94.3 million dollars. — in Japan; 1,224 (4.8%) in the amount of USD 59.0 million. — in the Americas, 917 (3.6%) in the amount of 13.1 million dollars. — in Turkey, 1198 (4.7%) in the amount of 19.4 million dollars. — in other countries.
TRENDS OF IMPORT OF NEW CARS BY COUNTRY OF MANUFACTURE
- Imports of new cars from China have grown significantly. Quantitatively, this figure increased from 2.4 thousand cars in 1 sq. Km. 2020 to 5.6 thousand in 1 sq. Km. 2021. Thus, new cars made in China accounted for 22% of the import structure.
- The share of new cars manufactured in the EU decreased from 53% to 49%.
- The share of new Japanese cars in the structure of imports decreased from 20.5% to 16%.
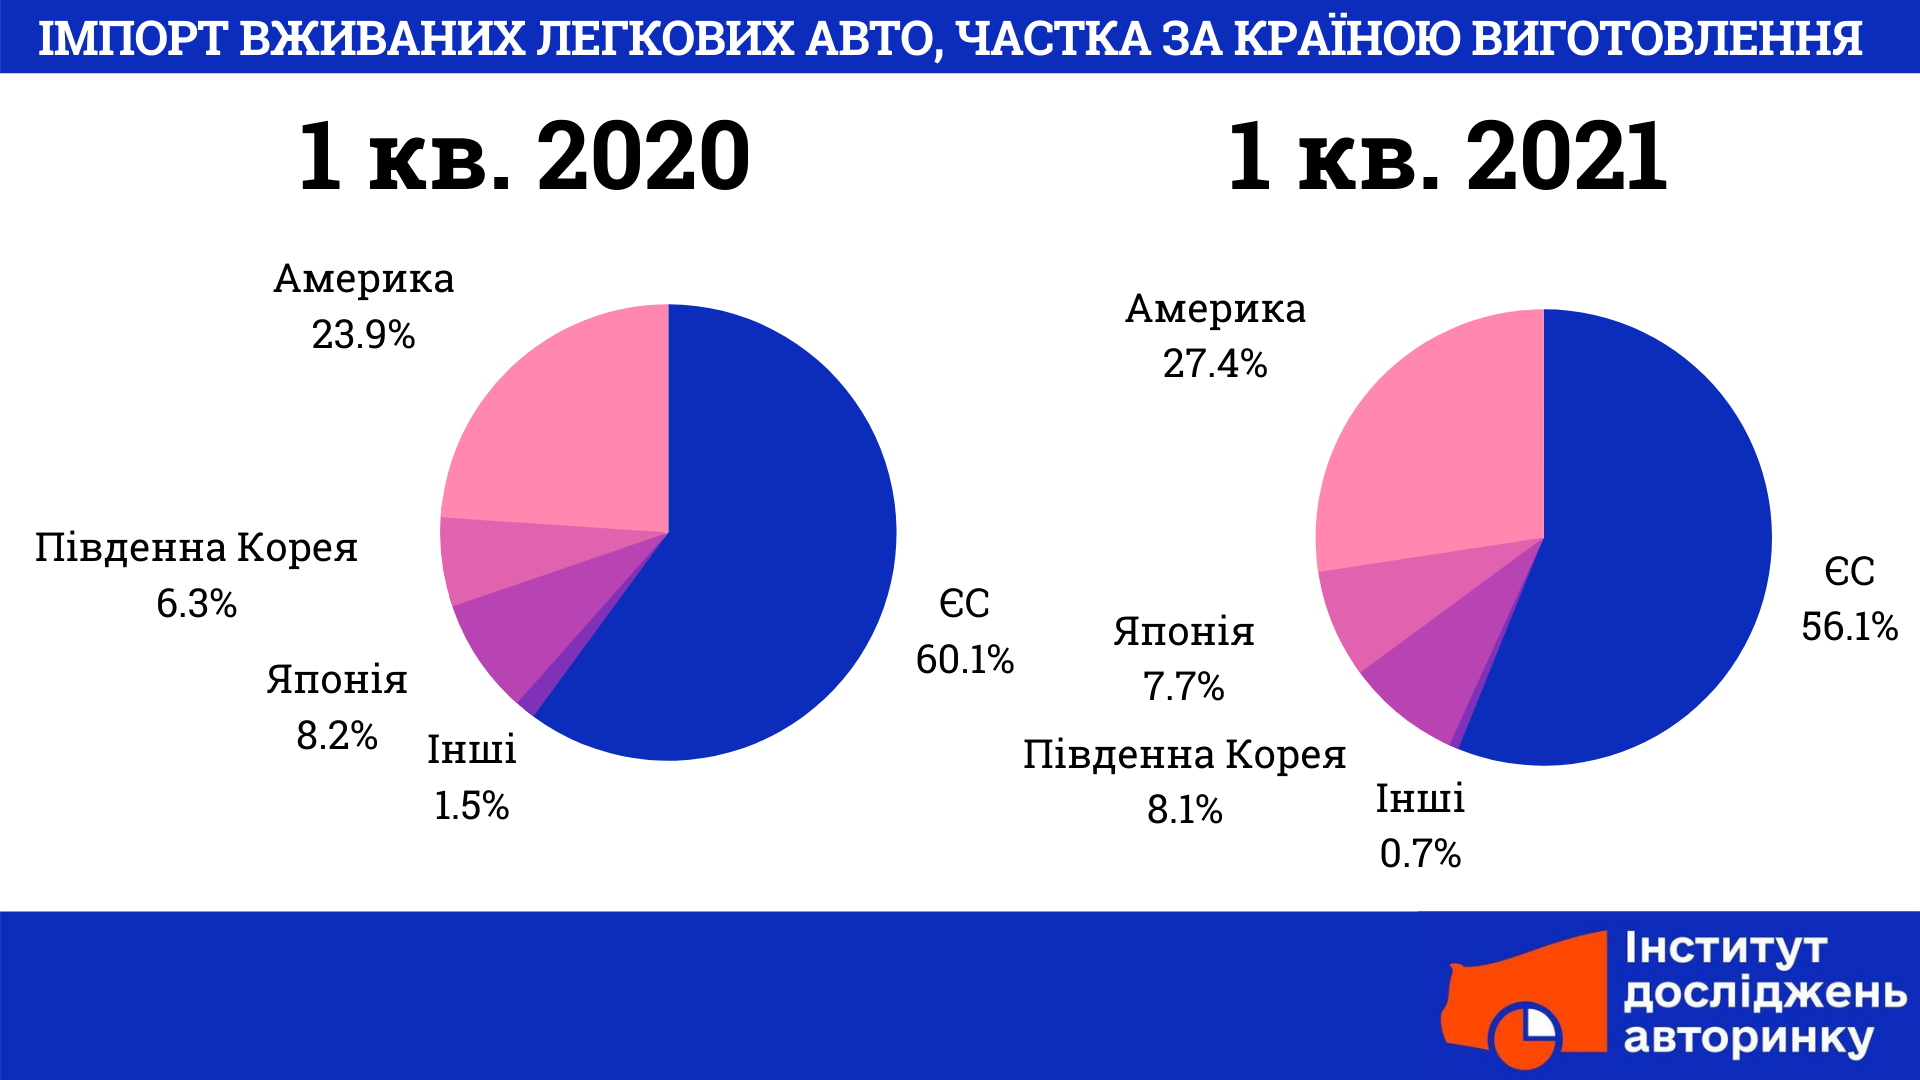
The structure of imports of used cars by country of origin in the 1st quarter of 2021 was as follows: 55,983 cars (56.1%) for a total of 181.5 million dollars. were manufactured in the EU, 27,357 (27.4%) worth $ 161.2 million. — in the Americas, 8082 (8.1%) in the amount of 29 million dollars. — in South Korea, 7,668 (7.7%) in the amount of 37 million dollars. — in Japan, 681 (0.7%) in the amount of 2.9 million dollars. — in other countries. Compared to the same period in 2020, the share of used cars from America and South Korea in imports is growing.
TRENDS OF IMPORT OF USED CARS BY COUNTRY OF ORIGIN
- Most of the imported cars from abroad are made in the countries of the European Union. Compared with 1 sq. Km. In 2020, the share of these cars in the structure of imports of used cars decreased — from 60% to 56%.
- The share of used cars from the European Union is decreasing, from America and South Korea — is growing. Imports of used cars from the Americas increased from 24% to 27%, and the share of cars from South Korea — from 6.3% to 8.1%.
VI. CONCLUSIONS
Imports of cars have grown. More new and used cars were imported. In total, in the first quarter of 2021, Ukrainians spent almost a billion dollars to buy cars from abroad. This amount is almost evenly distributed between new and used cars. At the same time, taxes for customs clearance of used cars were paid twice as much. This is due to the fact that the average amount of taxes on imports is twice lower for new cars, compared to cars with mileage. The tax burden is unevenly distributed: those who buy cheaper cars pay more.
Dynamics of imports. Despite external factors, the demand for cars is not decreasing. Ukrainians need mobility. The economic situation in Ukraine encourages the purchase of used cars. Insufficient number of cars on the secondary market inside the country contributes to an increase in imports of cars from abroad. The market for imports of used cars is four times larger than the market for imports of new ones. The growth of the market for imports of used cars does not lead to a decline in the market for imports of new cars, and vice versa.
The car business has adapted to the conditions of quarantine: it has transferred a significant number of processes online — from buying at auctions to remote car registration.
Fuel type. Global trends affect Ukraine: the number of imported gasoline cars is growing, and diesel — is declining. At the same time, both among new and used cars. This can be influenced by a set of factors.
The share of imported hybrid cars is negligible in terms of total quantity. The market of electric cars in Ukraine is also insignificant and does not show any growth, electric cars are not becoming more popular. In addition, most electric cars are used, also due to the economic situation in the country.
Geography of imports. Most cars imported to Ukraine from abroad, both new and used, are made in the European Union. This is facilitated by the geographical proximity of these countries, the convenience and speed of logistics, close economic ties.
The share of imports of new cars made in China has increased significantly. This is facilitated by their low price.
The growth is shown by the share of imported used cars from the USA. In most cases, these are cars after an accident, sold at insurance auctions in the United States. Despite the complexity of delivering such cars by sea, its high cost and time, the demand for such cars is growing. Mainly due to the relatively "fresh" years of production of these machines, low proven mileage, and low price.
Imports of used cars made in South Korea also increased. The cost and delivery time are on average similar to the same parameters for cars from America, but Korean cars are usually sold without damage, including those received in an accident.
